


 110 / 172

Abstracts of the 22
nd
National Congress of Digestive Diseases / Digestive and Liver Disease 48S2 (2016) e67–e231
e171
P.08.16
NEW IMPEDANCE-PH PARAMETERS OF GASTRO-ESOPHAGEAL
REFLUX DISEASE: A LESSON FROM PATIENTS WITH CHRONIC
AUTOIMMUNE ATROPHIC GASTRITIS, NON-EROSIVE REFLUX
DISEASE AND FUNCTIONAL HEARTBURN
Andrea T.*
1
, Debortoli N.
2
, Mauro A.
1
, Frazzoni M.
3
, Savarino E.
4
,
Massironi S.
1
, Marchi S.
2
, Penagini R.
1
1
1Gastroenterology and Endoscopy Unit - Fondazione IRCCS Ca’ Granda
Ospedale Maggiore Policlinico and Department of Pathophysiology and
Transplantation - Università degli Studi di Milano, Milan, Italy, Milano,
Italy,
2
2Department of Translational Research and New Technologies
in Medicine, University of Pisa, Pisa, Italy, Pisa, Italy,
3
3Digestive
Pathophysiology Unit and Digestive Endoscopy Unit, Baggiovara
Hospital, Modena, Italy, Modena, Italy,
4
4Department of Surgery,
Oncology and Gastroenterology, University of Padua, Padua, Italy,
Padua, Italy
Background and aim:
Factors influencing new markers of gastro-
esophageal reflux disease (GERD) detected by multichannel
impedance monitoring (MII-pH) (i.e., mean nocturnal baseline
impedance, MNBI and Post-reflux Swallow-induced Peristaltic
Wave, PSPW index (1)) are still to be definitively elucidated.
To evaluate this issue, we included three different groups of
patients with a peculiar MII-pH pattern: 1) patients with chronic
autoimmune atrophic gastritis (CAAG) and MII-pH evidence of
GERD (2) 2) patients with non-erosive reflux disease (NERD) and 3)
patients with functional heartburn (FH).
Material and methods:
Study design: Multi-center retrospective
analysis. Patients: 24 CAAG, 25 NERD and 25 FH patients. MII-pH
off PPI: All the tracings were retrospectively reviewed. GERD was
defined in presence of: i) increased acid exposure time (AET) and/or
ii) increased n° of total refluxes and/or iii) positive symptom index
(S.I.) and/or Symptom Association Probability (S.A.P.). Acid and non-
acid (i.e., weakly acid + weakly alkaline) as well as proximal refluxes
were reported. Normal values were based on (3), MNBI and PSPW
index were calculated according to (1). Statistical analysis: mean
and standard deviation was calculated. ANOVA was performed to
evaluate difference among groups (p significant when < 0.05).
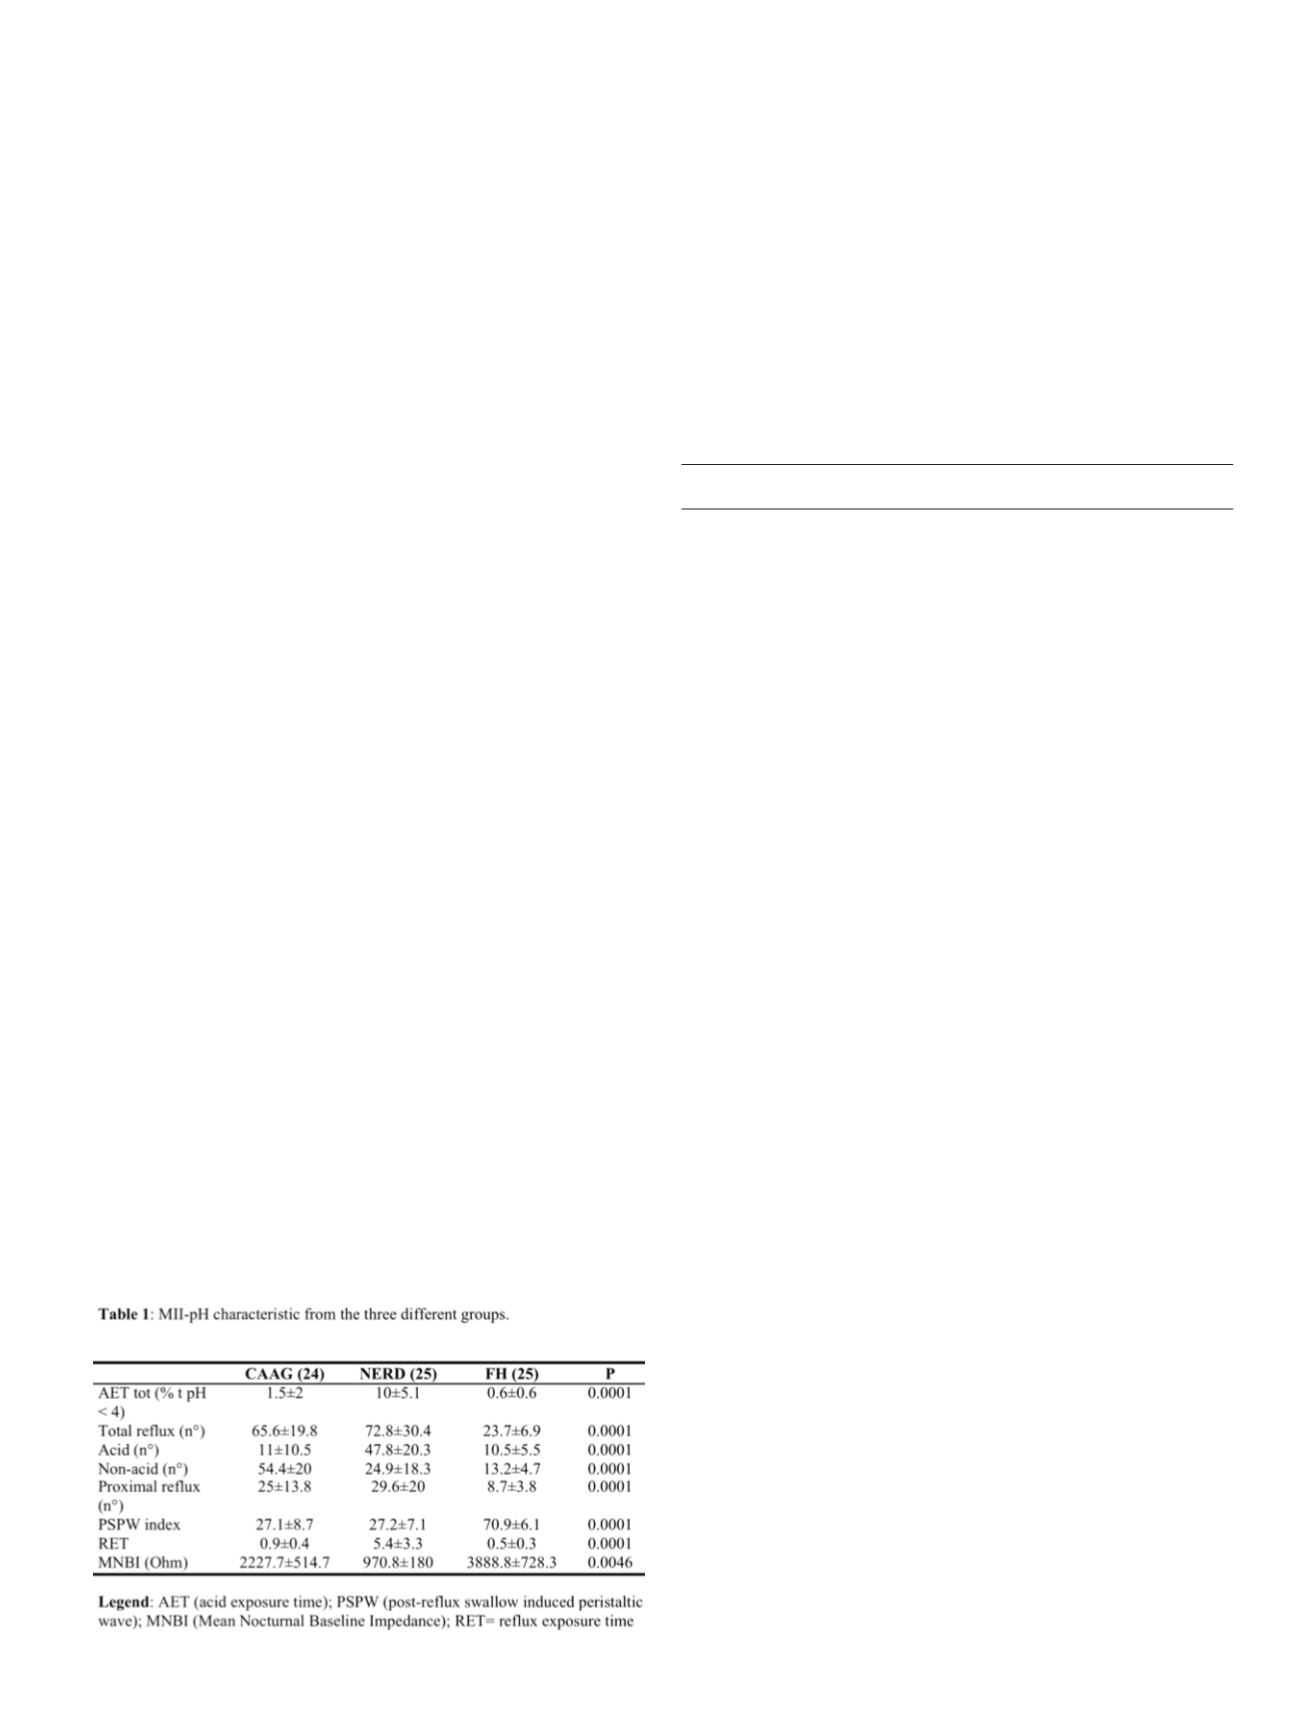
Results:
Ninteen/24 CAAG patients (79%) were symptomatic; all
NERD and FH patients had heartburn. All data are summarized in
Table 1. Females were more prevalent in CAAG and FH groups
(p<0.0001), whereas age and body max index (BMI) was similar
among the three groups. As expected, total AET was significantly
higher in NERD patients (p<0.0001). Furthermore, CAAG and NERD
patients had a higher number of refluxes compared to FH, being acid
ones more common among NERD patients and non-acid among
CAAG patients. Intriguingly, PSPW index was similar between CAAG
and NERD patients but significantly lower compared to FH group
(p<0.0001), whereas MNBI decreased progressively in FH (>3000
Ohm), CAAG (> 2000 Ohm) and NERD (< 1000 Ohm) patients
(p=0.0046).
Conclusions:
Our results showed that both PSPW index and MNBI
improve diagnostic accuracy of MII-pH in GERD. PSPW index is a
strong marker of GERD and is not affected by AET.
References
1. Frazzoni M, Savarino E, de Bortoli N, et al. Analyses of the Post-reflux Swallow-
induced Peristaltic Wave Index and Nocturnal Baseline Impedance Parameters
Increase the Diagnostic Yield of Patients With Reflux Disease. Clin Gastroenterol
Hepatol 2015.
2. Tenca A, Massironi S, Pugliese D, et al. Gastro-esophageal reflux and antisecretory
drugs use among patients with chronic autoimmune atrophic gastritis: a study
with ph-impedance monitoring. Neurogastroenterology and Motility [IN PRESS].
3. Zentilin P, Iiritano E, Dulbecco P, et al. Normal values of 24-h ambulatory intra-
luminal impedance combined with pH-metry in subjects eating a Mediterranean
diet. Dig Liver Dis 2006;38:226-32.
P.09 Colon 1
P.09.1
HIGHER ADENOMA DETECTION RATE BUT NOT ADVANCED
ADENOMA WITH ENDOCUFF-ASSISTED COLONOSCOPY IN A
SCREENING POPULATION
Cavallaro L.*, Lecis P., Galliani E., Dal Pont E., Giacomin A.,
Iuzzolino P., Macri E., Roldo C., Soppelsa F., Di Camillo S., Mel R.,
Bastianello G.
ULSS1 Ospedale Belluno, Belluno, Italy
Background and aim:
The Adenoma Detection Rate (ADR) is one
of the quality measures in screening colonoscopy. The lower the
ADR the higher the risk of cancers after colonoscopy. Endocuff is an
endoscopic cap with plastic projections which permits to flatten the
colonic fold duringwithdrawal. Endocuff-Assisted colonoscopy (EAC)
is potentially able to ameliorate the ADR which is crucial especially
in a screening population. To compare in a screening population:
ADR, advanced adenoma detection rate (AADR) and number of
adenoma detected between EAC and Standard colonoscopy (SC).
Material and methods:
We compared the performance of SC (from
January to September 2014) and EAC (from January to September
2015) both in consecutive Fecal Immunochemical Test (FIT) positive
and endoscopical Follo-up screening participants. Colonoscopy
was performed by the same team of endoscopists in both 2014 and
2015. ADR was defined as the number of colonoscopy with at least
one adenoma divided by the total number of colonoscopies; mean
number of adenoma per patient was defined as the total number of
detected adenomas divided by the number of colonoscopies; AADR
as the number of colonoscopy with at least one advanced adenoma
(defined as an adenoma of 1cm or grater, or with villous/tubule-
villous components or with high grade dysplasia) divided by the
number of colonoscopies.
Results:
403 (198 F, mean age: 60.4 years, 49-70) and 445 (186 F,
60.2, 49-70) subjects performed SC and EAC respectively. ADR was
46% in SC and 53% in EAC, p<0.05. Mean number of adenoma per
patient who undertook SC and EAC was 0.9 (range: 0-8) and 1.1
(range: 0-13) respectively, p<0.05. Advanced adenoma detection
rate was 27% and 23% in SC and EAC respectively, p=ns.
Conclusions:
EAC increases both adenoma detection rate and
the number of polyps detected. However, it does not ameliorate
advanced adenoma detection rate.